The Most Important Number This Week Wasn't a Home Price
Mortgage rates climbed for a fourth straight week as buyer demand cooled and Maryland's market shifted into a more balanced phase.

This week, the entire spread of Maryland’s housing market fit inside one city.
On July 24th, a private penthouse atop Harborview Towers in Baltimore hit the market for $4,295,000 two combined penthouses on the 26th floor, over 7,000 square feet, offered for the first time in more than two decades, available only by private appointment. A private keyed elevator opens into an exclusive lobby. Italian Carrara marble runs throughout. Seven private outdoor spaces look out over the Baltimore skyline.
Two days earlier, and three miles away, a HUD owned row home on N Ellamont Street listed for $5,000. Exterior viewing only. Interior access strictly prohibited. Sold as is, straight through HUD’s foreclosure process.
Same city. Same week. A $4,290,000 gap between the two.

But that’s not really this week’s headline.
The real story: after two weeks of acceleration, Maryland’s market tapped the brakes. Statewide closings dropped to 615 homes, down from 680 the week before. Pending contracts fell 11%, from 429 down to 382. Mortgage rates climbed for a fourth straight week, hitting 6.58% the highest level in nearly a year. And while homes that are priced right are still closing right at asking, sellers who don’t get the number right the first time are increasingly the ones left sitting.
Two weeks of momentum, and now a week of it cooling. That’s the pattern buyers and sellers both need to understand heading into August.
Maryland in 60 Seconds
For the skimmers here’s the whole week in one glance:
📉 Friedman Market Momentum Index: 50 / 100 Balanced, Cooling
📈 Homes Sold: 615 (down from 680 last week, -9.6%)
🏡 Active Listings: 1,193 statewide
💰 Median Sold Price: $415,000 (down from $437,950, -5.2%)
🏦 30 Year Mortgage Rate: 6.58% (up from 6.55%, 4th straight weekly increase)
⏱ Average Days on Market: 31 (up from 28)
🏷 Price Reductions: 1,101 listings (down slightly from 1,145)
📋 Pending Contracts: 382 (down from 429, -11.0%)
A quick data note: this week’s pull labels statewide inventory as “1,193” but when you add up the active listings across all thirteen counties in this week’s data, they sum to almost exactly that number. So rather than compare it to last week’s “1,292 new listings” figure as if it were the same thing, I’m flagging it here as active inventory instead. Same commitment to not papering over the data gaps as always.
What the Numbers Really Mean
Three things changed this week.
Closings pulled back after their rebound. 615 homes closed statewide, down 9.6% from 680 the week before. Pending contracts fell even further down 11% to 382 which matters more than the closings number itself, because pending contracts are the leading indicator. If that trend holds, next week’s closings could soften again.
Rates are now a four week story, not a one week story. The 30 year fixed climbed to 6.58% as of July 23rd, according to Freddie Mac its fourth consecutive weekly increase and the highest level since August 2025. The 15 year followed the same path, rising to 5.96%. This isn’t a blip anymore. It’s a trend, and it’s starting to show up in the demand numbers.
Precision pricing is still winning but the margin for error just got smaller. Statewide, closed homes sold at a median of exactly 100% of list price, with the average pulled up to 104.8% by a handful of strong performers. At the same time, 1,101 active listings still carry a price cut this week. Translation: sellers who nail the number are doing fine. Sellers who don’t are the ones absorbing the slowdown.

Market Spotlight: Baltimore City & Baltimore County
I don’t have hyperlocal, neighborhood level data for this week’s pull the way I did with Ruxton a couple weeks back so instead of guessing, I’m zooming in on the two Baltimore area markets I do have solid numbers for, and where this week’s most interesting stories actually live.
Baltimore City
Active: 283 · Closed: 107 · Avg. DOM: 41 days
Baltimore City’s pace actually improved this week average days on market dropped from 45 to 41. Closing volume of 107 homes remains the second highest in the state, trailing only Baltimore County. And this is also where both bookends of this week’s price range live: the $4,295,000 penthouse and the $5,000 HUD foreclosure are neighbors, in market terms, illustrating just how wide Baltimore City’s range really is from ultra luxury waterfront towers to entry level foreclosure stock, in the same 41 day average window.
Baltimore County
Active: 234 · Closed: 123 · Avg. DOM: 22 days
Baltimore County closed 123 homes this week, down from 156 the week before. On its own, that reads like a slowdown. But average days on market actually fell too from 26 days to 22. Fewer transactions, but the ones happening are moving faster. That combination lower volume, quicker pace usually points to a tighter, more selective buyer pool rather than a genuinely weakening market.
Bottom line: if you own a home in either market, well priced listings are still moving in three weeks or less. The homes sitting are the ones priced for last month’s market, not this one.
Market Movers of the Week
The numbers people actually want to talk about at dinner:
🏆 Most Expensive Active Listing
100 Harborview Dr #PH3A/3B, Baltimore, MD 21230 $4,295,000
5 beds | 4 full, 2 half baths | 7,362 sq ft | Built 2003
Two combined penthouses on the 26th floor of Harborview Towers. Private keyed elevator, seven private outdoor spaces, offered for the first time in over two decades.
🏠 Least Expensive Active Listing
42 N Ellamont St, Baltimore, MD 2122 $5,000
2 beds | 1 bath | 972 sq ft | Built 1927
A HUD owned rowhome, fee simple (not ground rent), sold strictly as is through HUD Home Store’s foreclosure process. Exterior viewing only interior access is prohibited until sale.
⚡ Fastest Moving County Carroll County 19 day average DOM, 34 closings
🐌 Slowest Moving County Garrett County 108 day average DOM, 6 closings
Friedman Heat Map: This Week’s County Data
Hottest Markets (fastest average days on market)
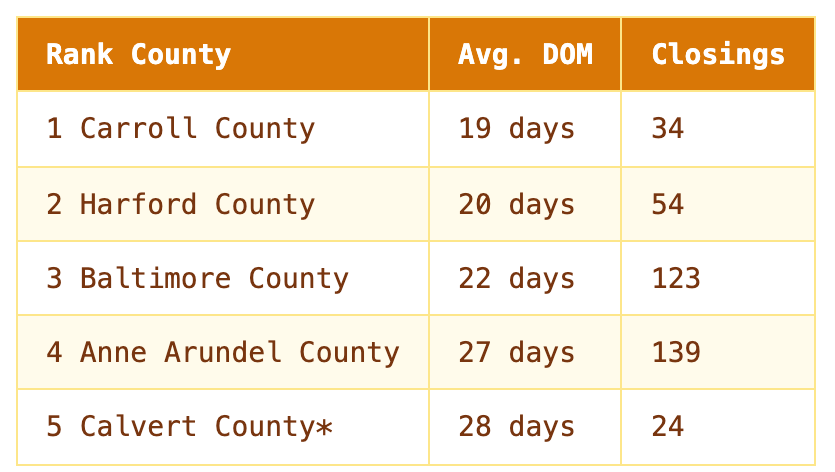
*Charles County is essentially tied at 28 days with 27 closings.
Cooling Markets (slowest average days on market)
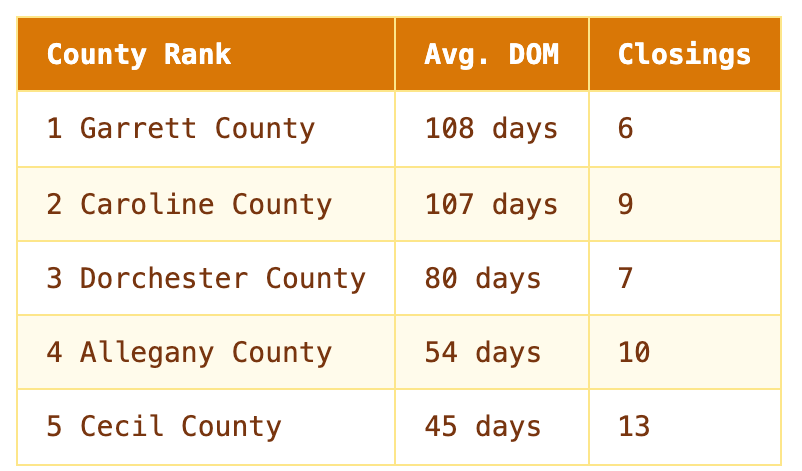
Baltimore County remains the workhorse of the fast moving group no other top 5 county comes close to its 123 closings this week. On the cooling side, Garrett and Caroline are essentially tied for the slowest pace in the state, both averaging well over 100 days to close.
Week Over Week: How Maryland Compares
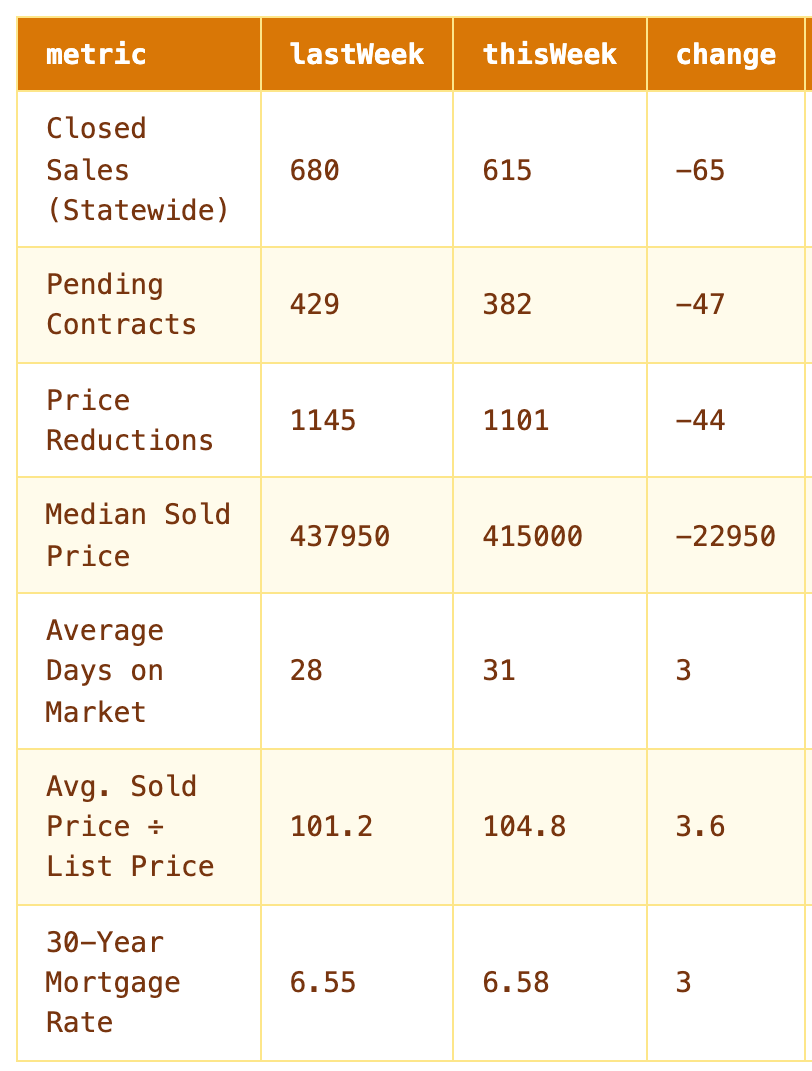
The headline: closings, pending contracts, and median sold price all pulled back this week after two straight weeks of gains, while mortgage rates extended their climb into a fourth week. The one bright spot homes that do close are closing further above list price than they were last week.
The Friedman Market Momentum Index (FMMI)
SCORE: 50 / 100 Balanced Market, Cooling Momentum
(down from 62 last week)
Demand Score: 45 (down from 65) Closings fell 9.6% and pending contracts dropped 11% the clearest signs of softening buyer momentum this week.
Seller Strength Score: 52 (down from 55) The average sold to list ratio actually strengthened to 104.8%, but 1,101 active listings still carry a price cut, keeping this component in check.
Market Speed Score: 60 (down from 75) Average days on market rose from 28 to 31 a real, if modest, slowdown in pace.
Rate Environment Score: 35 (down from 40) The 30 year fixed hit 6.58% a fourth consecutive weekly increase and the highest level since August 2025.
What this means: Maryland shifted this week from “balanced, holding steady” to “balanced, but losing momentum.” No single number here is alarming on its own but demand, pace, and rates are all now leaning the same direction, and that’s worth watching over the next couple of weeks.
The Friedman Signal™
📉 COOLING
Three straight indicators closings, pending contracts, and rates moved the wrong direction for sellers this week, while median sold price gave back some of last week’s gain. This isn’t a downturn. It’s a market that ran hot for two weeks and is now catching its breath under the weight of a fourth consecutive rate increase.
Watch pending contracts closely heading into next week that 11% drop is the number most likely to show up in closings two to four weeks from now.

Winners & Losers
Winners This Week
Baltimore County fewer closings, but a faster pace (22 day average DOM, down from 26)
Carroll & Harford Counties both closing in under 20 days on average
Precisely priced homes median sold to list ratio held at exactly 100%
Losing Momentum
Statewide demand closings down 9.6%, pending contracts down 11%
Rate sensitive buyers four straight weekly increases, now at 6.58%
Garrett & Caroline Counties both averaging well over 100 days on market
One Thing I’d Do This Week
If I were buying: Move on the reduced price pool now. With 1,101 active listings already carrying a cut and pending contracts falling, there’s real negotiating room but a fourth straight rate increase means that leverage has a shelf life. Don’t wait it out.
If I were selling: Price at the $415,000 statewide median reality, not the $437,950 you might have been expecting two weeks ago. Pending contracts are down 11% buyers have more selection right now, and ambitious pricing is the fastest way to end up in next week’s pricereduction count instead of this week’s closing report.
If I were investing: Baltimore City remains the deepest, most liquid market in the state 283 active listings, 107 closings, and a pace that’s actually improving (down to 41 days from 45). Keep an eye on the HUD and foreclosure pipeline here specifically; the $5,000 Ellamont Street listing is a reminder that below market entry points still exist for patient, well capitalized buyers willing to navigate the process.
Have Questions? Let’s Talk.
📞 443-789-3101 | Kyle@Friedmanreteam.com
8115 Maple Lawn Blvd. #350 Fulton, MD 20759